Forecast API: the AI-powered platform for air quality data
Integrate the world’s most accurate, high-resolution, and built-to-scale environmental data.
get in touchIntegrate the world’s most accurate, high-resolution, and built-to-scale environmental data.
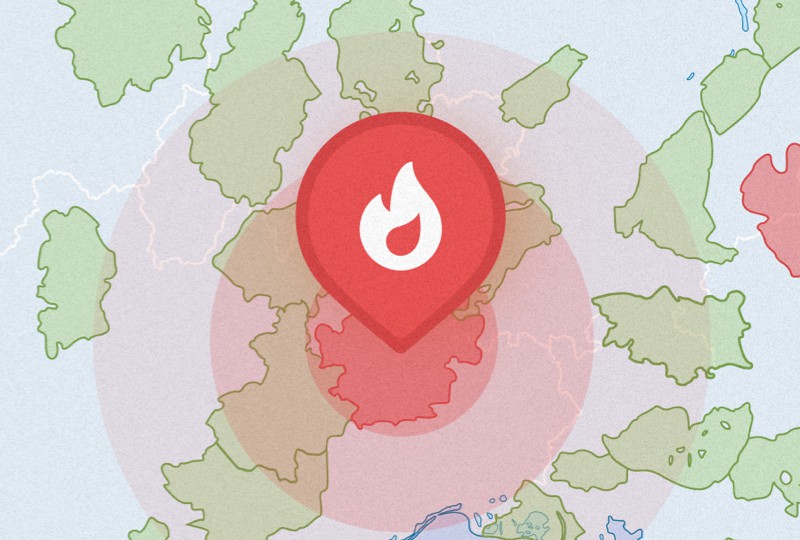
get in touchWe provide air quality information for any location —getting right down to street level in over 100 major cities around the world. We draw on over 12,000 monitoring stations and our own cutting-edge models, integrating an astonishing amount of data including weather information, population density, land-use and road networks.
Check out our Air Quality MapsExplore essential environmental monitoring data
that makes a difference—always evolving, always up to date.
Major pollutant concentrations, also expressed in your local AQI and our own unified Plume AQI
Real-time and forecasts up to 7 days
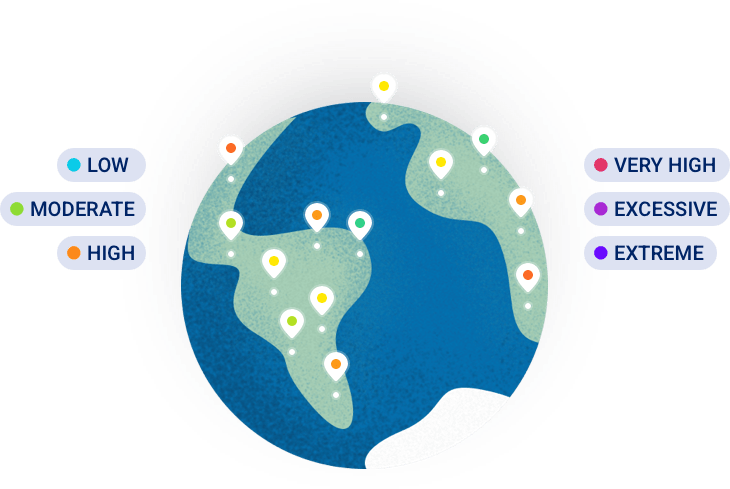
Global coverage
We continuously add new features—constantly innovating and evolving.
Contact us to learn about current developments and even try them out!
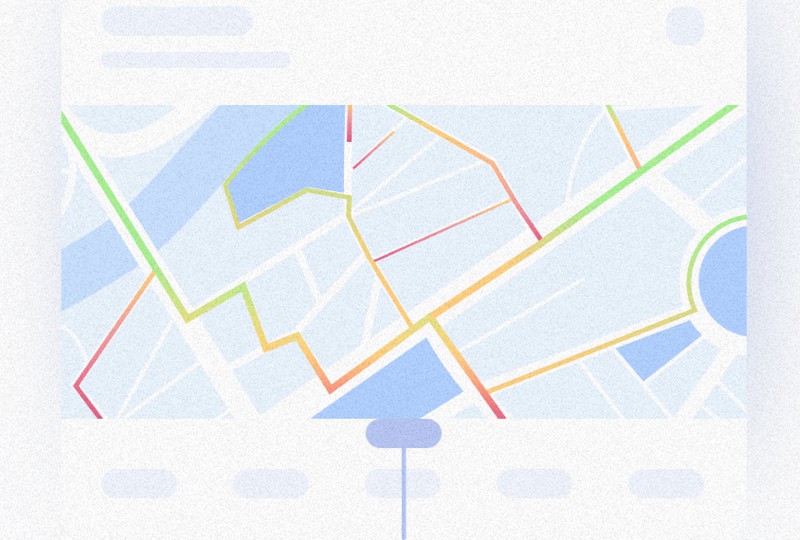
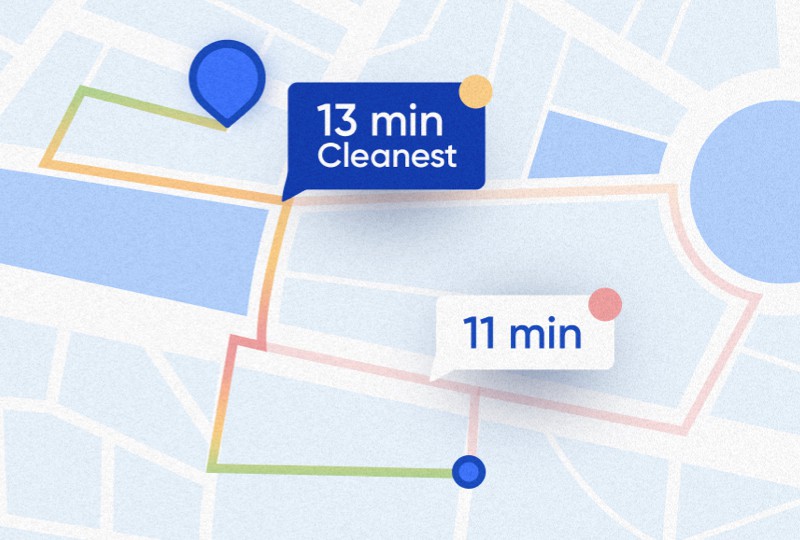
Calculate and map routes with the cleanest air and steer clear of pollution.
Contact usWe built our own proprietary spatio-temporal and forecasting models using state-of-the-art machine learning and AI. These models are applied to a large variety of data sources and allow us to provide best-in-class air quality data.
Learn moreUp to 6 times more accurate than benchmark models
7 days hourly air quality predictions
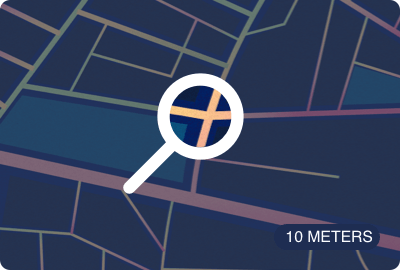
Street-level resolution up to 10m in areas of high population density
Up to 6 times more accurate than benchmark models
Our widely-used air quality forecast app and data platform show best-in-class reliability and scalability. In fact, they’re already powering many large-scale client applications.
Check out Plume Labs AppWe have a flexible pricing model that adapts to your needs —based on request volumes, forecast horizon, and on the different API options available. Contact us for an estimate based on your needs.
Get a quoteWe support academic research, NGOs and local community projects working to improve air quality with access to our platform. Please contact us to discuss your project.
Contact usWe capture the latest pollution levels from over 12,000 monitoring stations and 80 public agencies around the world.

Our custom quality control system filters for errors, outliers, station downtime (e.g. maintenance, power outages) and more.
We source local atmospheric data (wind, temperature, humidity, pressure, etc.) to track their influence on pollution levels in your city.


Our team of data and atmospheric scientists analyzes local specifics such as geographical features, land use, population density, and human activities—because each city is unique.
Our AI algorithms and atmospheric models turn this massive amount of data into hourly forecasts, maps, and more. This means you get truly real-time data, and predictions up to 7 days in advance.
Which pollutants are available in the Air Quality API?
We cover the main pollutants that matter to your health: PM2.5, PM10, NO2 and O3. We also provide SO2 and CO concentrations.
What other features are available in the API?
On top of Air Quality API, we can also provide live and forecast data for UV worldwide, and pollen data Europe and in the US. We’re also working to make fires, maps and itineraries recommendations available very shortly! If you’re interested in these products, reach out to us!
What information does a call return?
When you make a request to the API for a given location (latitude and longitude), it returns hour-by-hour estimates for each pollutant, for the current time and over the next 168 hours (7 days). Pollutant levels are returned in absolute concentrations (µg/m3), as well as in various air quality indexes: the European AQI (caqi), the Chinese AQI (aqi_cn), the US AQI (aqi), the United Arab Emirates AQI (aqi_ad) and our own Plume AQI (pi). Learn more about AQI
How do you calculate the Plume AQI?
Our Plume AQI is designed to mirror international health recommendations related to air pollution exposure. It takes into account the pollutants that have a proven impact on our health and thresholds are determined in line with WHO guidelines. Each of the 7 categories of the Plume AQI, from Low Pollution to Airpocalypse, indicates something specific about the length of time one can be exposed to such pollutant rates without an adverse impact on health. At “High Pollution” levels, for example, an exposure longer than 24 hours is harmful for human health. Learn more about AQI
How many countries do you cover?
The Plume API covers the entire terrestrial world. You can get air quality data for any given location –apart from oceans, not a single point on Earth is left out.
What is the spatial resolution of your data coverage?
It depends on the area you’re looking at: where street-level city maps are available, the resolution can be as high as 10 meters. In Europe, the US, China, Japan and South Korea, our spatial resolution is up to 1km. In the rest of the world, it ranges from 10km to 40km.
Are historical reports available?
You may access historical data via on-demand request — they are not directly provided through our API. If you need historical reports, please get in touch with us.
We're here to help!
Questions about Flow? 🤔
Click here for our Help Center!
Contact Us ✍️
Press and Media, Business Inquiries, Support and Feedback.